Price models
Price models (also called figures or patterns) are important tools used in graphical analysis of markets. Price figures help clients identify key points in price movements and indicate upcoming changes in trends. Based on the nature of the upcoming movement there are two types of graphic models:
- Trend reversal figures;
- Figures of continuation of a trend.
An important advantage of price models is the ability to use them at different price intervals, depending on your preferences and financial capabilities. Although we want to warn you right away that the higher the time frame, the more important the price model is.
Trend reversal figures
Trend reversal patterns indicate the current trend is weak and the opposite movement may start. Using such models, you will be able to close positions that you opened in accordance with the current trend in time, as well as open new deals and increase your profit. There are two main reversal patterns: Head and Shoulders and Double Peak.
Head and Shoulders
This figure is one of the most encountered and reliable price models of technical analysis. The appearance of the figure portends either the end of the trend or an impending correction.
The classic version of the development of the figure «Head and shoulders» is as follows:
1. On the chart, there is an upward movement (rising highs and lows).
2. The next maximum does not reach the previous level, which is a sign of a downtrend.
3. After passing a certain level, the price sharply rushes down.
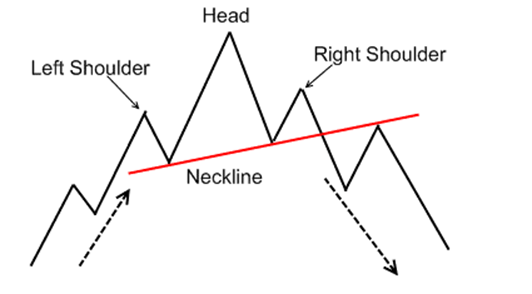
The level after which the price goes down is called the «neckline». This line is drawn using the last two minimums, and it can either be horizontal or have an upward slope. After breaking the «neckline» from top to bottom, there is a good sell signal, and we know not only the place to open a position, but also to close it. To do this, measure the height of the «head» from the «neckline» and move this distance down from the moment of the breakdown. The resulting level will be the price benchmark that the price will probably pass before the next correction. Here we will place a Take Profit order.
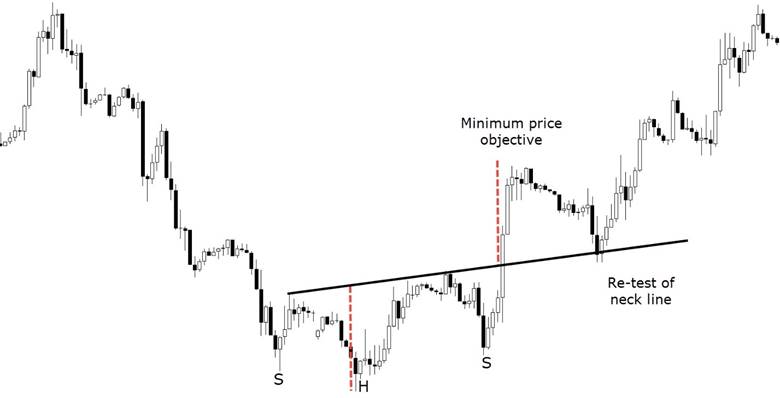
Please note that after reaching the price target (often earlier), the price may go back in the same direction (in this case, it may go up). The figure is used only once and no longer participates in the analysis. The rule applies to all other figures
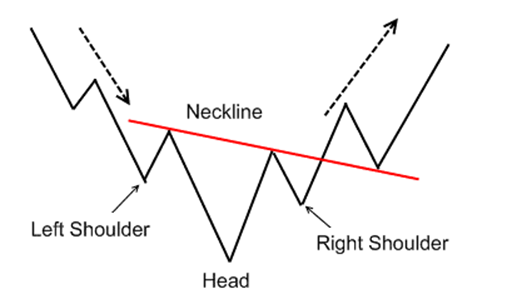
Since the trend is not only upward, but also downward, the «head and shoulders» pattern can also occur at the bottom of the market. It’s called «Inverted Head and Shoulders». This figure is a mirror image of the previous price model that occurs at the end of a downtrend. Three minimums, central below the lateral ones, the «neckline» is horizontal or has a downward slope. Breakdown of the «neckline» is carried out from the bottom up, after which a buy signal appears. The price benchmark is also pushed up.
Double Peak
Another strong and fairly frequent figure in the market is a double top. The classic version of the development of this figure is as follows:
1. On the chart, there is an upward movement (rising highs and lows).
2. The next maximum is approximately equal to the previous one (there is no concrete sign of a downtrend yet).
3. After passing a certain level, the price sharply rushes down.
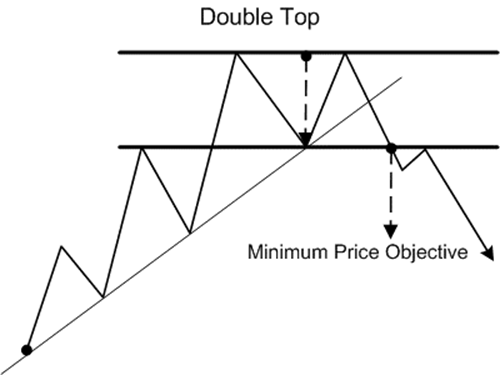
The level after which the price rushes down is a kind of support, which is built on the last minimum between the two peaks. After breaking through support from top to bottom, a good sell signal appears. Next, you need to measure the height of the figure from support to one of the highs and move this distance down from the moment of breakdown. The resulting level will be the price benchmark that the price will probably pass before the next correction. If you look at the essence of the «Double Peak» figure, then this is a kind of lateral trend, incomplete in development. Consequently, the figure can also be a «Triple peak» (three peaks and two lows). The scheme of work is the same (the breakdown of support).
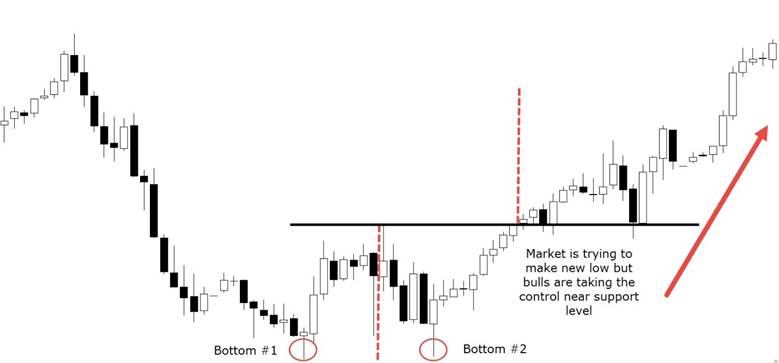
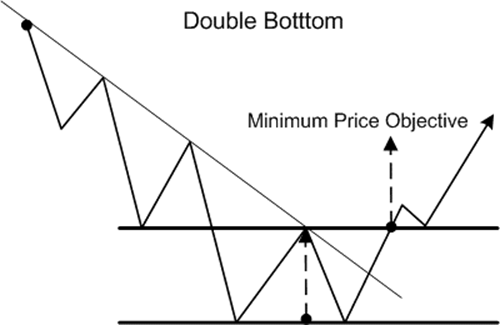
This figure is a mirror image of the previous price model that occurs at the end of a downtrend. Two equal minimums with a maximum between them (the resistance level is built on it). Breakdown of the «neckline» is carried out from the bottom up, after which a buy signal appears. The price benchmark is also pushed up.
Figures of continuation of a trend
The second group of price models is the continuation of the trend. When such patterns occur, you get a signal that the current trend has taken a break, but after a while, the previous movement will resume.
Triangles: ascending, descending, symmetrical
These figures are formed at a time when the struggle of «bulls » and «bears» is temporarily stopped since neither of them has the strength to continue their movements. At the same time, the triangle allows you to see which side the advantage is on and thus predict the future price movement. The «rising triangle» («bull triangle») represents several highs and lows, with the highs forming the horizontal resistance level, and the lows forming a trend line with an upward slope. Since the model belongs to the figures of the continuation of the trend, it is the continuation that is to be expected (in this case, up). Breakdown of resistance gives a good opportunity to open a buy position. Price guideline – the height of the widest part of the triangle, delayed from the moment of breakdown.
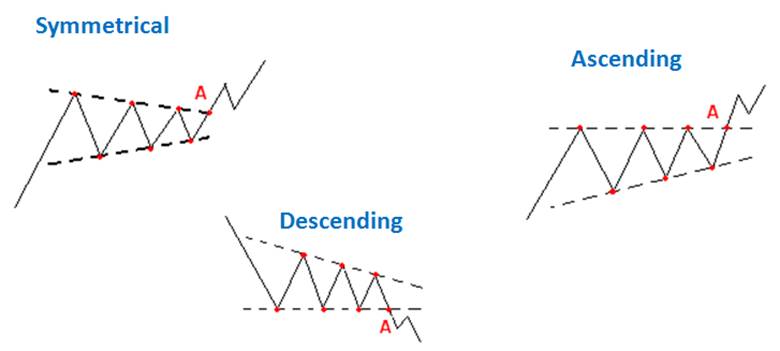
The «descending triangle» («bearish triangle») represents several highs and lows, with the highs forming a downward trend line and the lows forming a horizontal support level. The breakdown of support gives a good opportunity to open a position for sale. Price guideline – the height of the widest part of the triangle, delayed from the moment of breakdown.
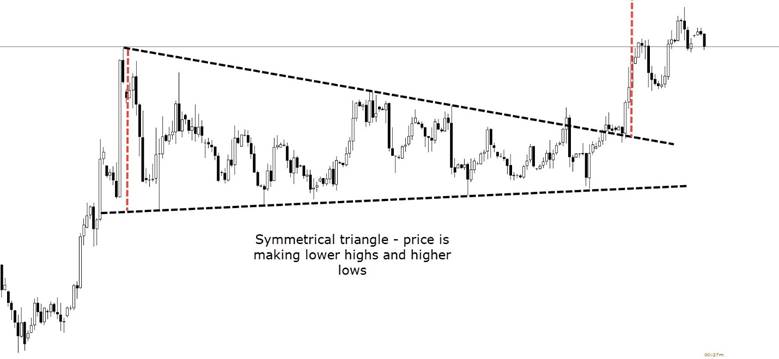
Another variation of this figure is a symmetrical triangle, which is characterized in that its lower border grows, and the upper one falls, that is, the lines gradually approach each other. The advantage of such a figure is that you can make deals when any of the boundaries are broken: if the triangle breaks up, then we buy, if down – we sell. The minus of the figure is poor reliability, it works much worse than other price models.
Flag and Pennant
These figures most often occur after the news, as well as other factors causing sharp price movements in one direction or another. The main and mandatory feature of both figures is the presence of an almost vertical «flagpole» formed from almost one white candle (rising flag and pennant) or black candles (inverted flag and pennant). After such a sharp movement, as a rule, a correction occurs in the form of a rectangle or triangle, which make up the flag or pennant banner.
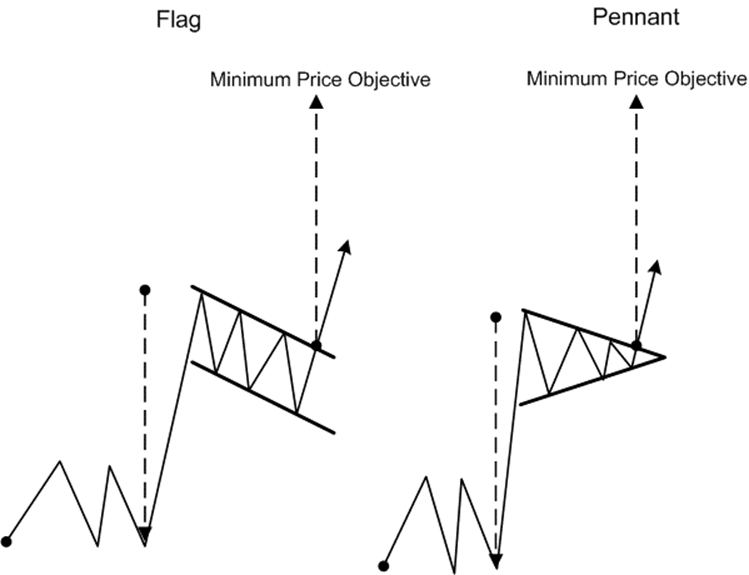
The shape of the banner is key in determining the type of figure: the flag has a rectangular banner, the pennant has a triangular one. Transactions begin after a breakdown at the price of the lower border of the banner for descending figures and the upper for ascending ones (continued movement). In the first case, the sale is carried out, in the second – the purchase. A reference point for profit taking is the height of the shaft postponed from the moment of the breakdown of the panel.