Indicators and oscillators
Indicators and oscillators are tools that help determine the prevailing trend and mood of market participants and are also used to determine pivot points and search for points for opening and closing transactions.
The most popular methods are:
- Moving Averages: SMA / WMA / EMA
- Bollinger Bands
Some of the most popular oscillators:
- MACD
- RSI
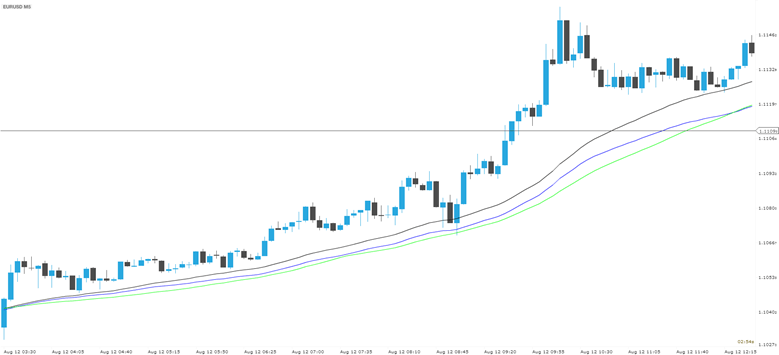
Moving averages are the main indicator for determining trends. When the price of the instrument is above the moving average, it is considered that the movement is suitable for purchases, and when lower – for sales. This is a very simple but very effective tool.
In the picture above we see three averages – simple, exponential and weighted with a period of 50.
Moving averages are used to identify the direction of the current trend. Each type of moving average is calculated by averaging the number of recent price values. Moving averages can be calculated based on the closing price, opening price, maximum and minimum prices (the closing price is most often used Close).
To identify significant levels, long-term supports and resistance, as well as major trends, 50-day, 100-day and 200-day moving averages are used.
The main investment signal for the moving average appears at the moment when prices cross the indicator. A sell signal appears when the price crosses the average from top to bottom. This suggests that the market is losing momentum and not sufficiently effective compared to the moving average.
The buy signal, on the contrary, occurs at the moment when the price of the asset crosses the moving average from the bottom up. This indicates that the price is growing at a faster pace than the indicator. For this reason, a similar situation is usually considered as a potential opportunity to open up for a purchase.
Investment signals on several moving averages
Clients often set multiple moving averages on the same price chart. One of them is called the fast moving average and has a shorter period (fewer data points for calculation), and the other is slow. Naturally, a fast-moving average will be more volatile than a slow one.
Investment signals on multiple moving averages
Bollinger Bands are a moving average and two lines above and below it. These lines are calculated according to the standard deviation from the moving average, so the more volatile the market, the wider the range between the Bollinger Bands.
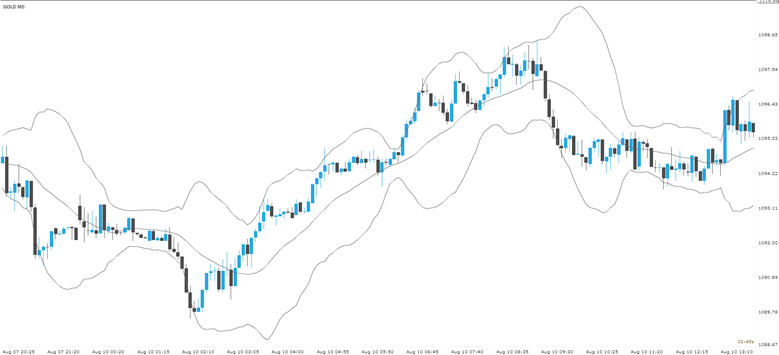
Let’s decide when we should expect growth and buy, and when it is best to sell the instrument, based on Bollinger Bands
Upward trend
- If the uptrend is strong, it always reaches the upper band of the channel. Reaching the upper band and the absence of a sharp correction suggests that buying activity remains strong and we should buy.
- When the price is adjusted as part of an uptrend, it should stay above the midline. If this happened, and then the price went up again to the upper border, you need to open to increase.
- During an uptrend, the price should not reach the level of the lower band; if this happened, the trend slows down and a trend reversal is possible.
Downward trend
- If the downtrend is strong, it always reaches the lower band of the channel. Reaching the lower band and the absence of a sharp correction indicates that purchasing activity remains weak and we should sell.
- When the price is adjusted within the downtrend, it should be kept below the midline. If this happened, and then the price again went down to the lower border, you need to open for a decrease.
- During a downtrend, the price should not reach the level of the upper band; if this happens, it means that the trend is slowing down and a reversal of the trend is possible.
Oscillators
Oscillators got their name because they oscillate (resembling movements of a sinusoid) around a horizontal line called the balance line. This line is a zero mark, where there is no momentum for both growth and fall.
Characteristics of the oscillators
- They determine when the price is susceptible to correction (in other words, you will know the moment the prevailing trend is completed).
- It gives a sell signal in the overbought zone and a buy signal in the oversold zone.
- It shows the discrepancy between the price on the chart and the readings of the oscillator, which is useful when making decisions for transactions with non-deliverable OTC financial instruments.
MACD
MACD indicator was developed by Gerald Appel. It shows the difference of two exponential moving averages, and also superimposes a 9-period average called the signal line on this difference.
Currently, the standard settings for the MACD indicator look like this: 12-26-9. Here 12 and 26 are the two main exponential averages, and 9 is the period of the signal line.
The result is a smooth oscillator that can give signals for opening a deal: crossing the zero line, divergence, crossing the signal line in overbought or oversold conditions.
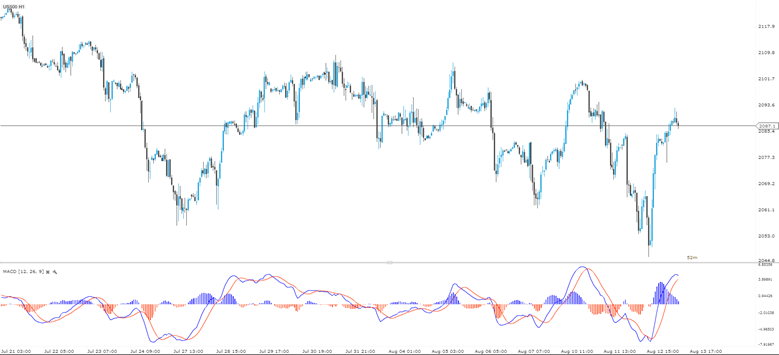
Let’s look at the investment signals that are generated using the MACD.
A buy signal is generated when the blue MACD line crosses the MACD signal line (red). Similarly, when the blue line crosses the red line down, a sell signal appears.
You can also think about deals when the blue line crosses the zero level. A buy signal is generated when the blue line goes above the zero line, and a sell signal is generated when it crosses the zero from top to bottom.
Also, an important element of the strategy for transactions with non-deliverable OTC financial instruments on the MACD is the search for divergences and convergence that can timely warn us about the end of the current trend.
RSI (relative strength index)
The RSI indicator is a technical momentum indicator that compares the magnitude of recent growth against a recent fall and identifies when the underlying asset is overbought or oversold.
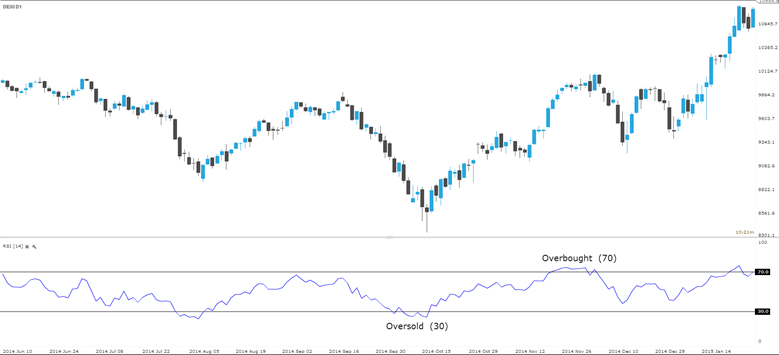
RSI is probably one of the most common oscillators, the standard period is 14. If the RSI falls below 30, we are talking about the level of oversold. This means that the market decline has dragged on, and there is a possibility of a reverse (bullish) movement, that is, there is an opportunity to buy.
On the other hand, if the RSI value rises above 70, then we are talking about an overbought instrument. This signal indicates that the resistance level for this asset is very close or has already been reached, and the tool strengthening rate may drop. Clients interpret this signal as an opportunity to sell.
Remember that you significantly increase your chances of success if you use investment signals as part of the main trend.