Fibonacci numbers
The Italian mathematician Leonardo Pisano is considered to be the author of the Fibonacci sequence, although even before this sequence was known for many centuries. Fibonacci numbers are an ever-growing digital series, where each next digit is the sum of the previous two numbers. As a result, the following sequence is obtained: 1, 1, 2, 3, 5, 8, 13, 21, 34, 55, 89, and so on to infinity.
Calculation example: 1 + 1 = 2 or 3 + 5 = 8
This numerical ratio has been used in over-the-counter Forex markets for more than a hundred years. Of particular importance is the Phi gold number. Phi was created by the golden ratio. The Golden Ratio is the ratio of any two consecutive numbers from the Fibonacci sequence, where the larger number is the numerator and the smaller is the denominator. The result is always approximately 1.618, as shown below:
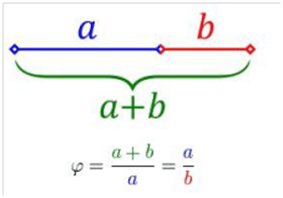
a = 0.618
b = 0.382
0.618/0.382 = 1.618
Golden ratio: 0.618 + 0.382 = 1.000
There are many options and methods for calculating Fibonacci, but we will focus on the practical use of these figures so that you can apply the knowledge when you make investment transactions.
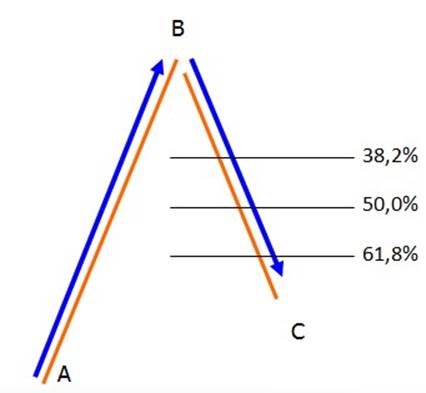
Fibonacci corrections help in determining potential resistance and support levels on the asset price chart. This method is based on the hypothesis that after an impulsive movement, the price will return by a certain percentage of the initial movement, after which it will continue to move in the same direction. Often, the correction value is equal to the Fibonacci percentage of the previous wave. Historically, the most important areas in the area of which corrections take place are 38.2%, 50% and 61.8%. These are the levels that most analysts pay attention to because they can become potential points of market reversal.
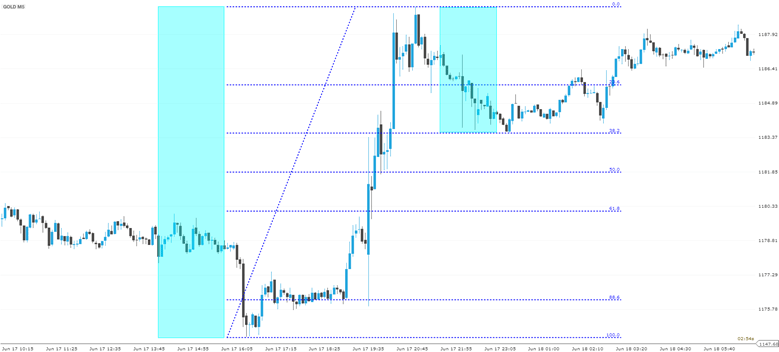
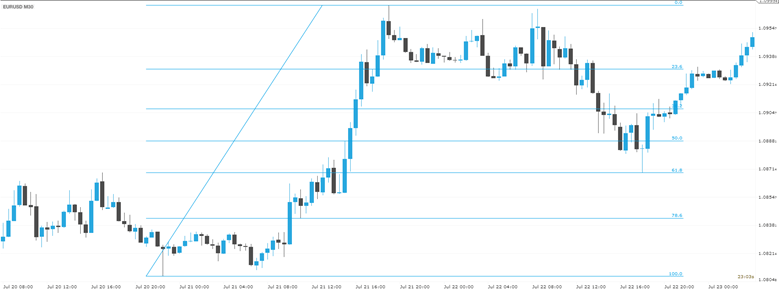
For example, below we see a graph of the price of gold, where there was an increase in prices in the region of $ 1,190. Then the price fell by 38.2% from the previous growth, after which the market stabilized and the rally continued.
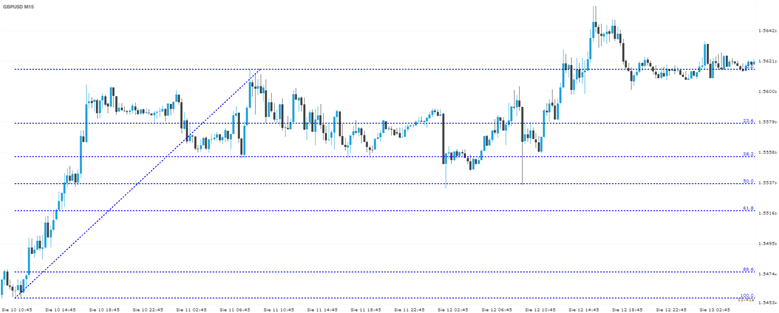
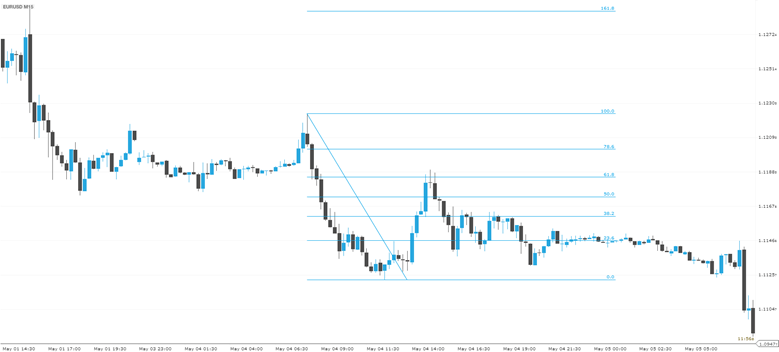
The following chart shows the GBP/USD pair on a 15-minute chart. As we see, after the upward movement, the markets began to return to the area of 38.2% but did not stay at this mark and continued to fall to the next figure of 50%. Then the market recovered and continued the previous growth trend.
The analysis of Fibonacci numbers allows customers to predict support and resistance levels on a price correction, and also helps to identify goals and potential turning points in the market.
How to draw a Fibonacci grid on the chart:
When drawing a line of impulsive movement, it is preferable to use the shadows of candles, since the study includes market extremes. In principle, often the difference between the bodies and the shadows of the candles is small, but sometimes this can be crucial. In the examples below, you can see that during market corrections, candlestick shadows often touched Fibonacci levels before changing direction.
Fibonacci levels can be an effective tool for optimizing trending strategies. For example, as part of this method, customers observe important price levels that are forming as part of a trend. And then they open positions during corrective movements (such transactions are considered less risky). At the same time, customers expect that the price will most likely start from Fibonacci levels before moving further in the direction of the main trend. In the example below, the price returned to the level of 61.8% before continuing to fall. The chances of a market reversal near the Fibonacci levels are even greater if they coincide with the graphic levels of support or resistance that you have previously outlined for a particular instrument.
In this lesson, we gave only brief information about strategies based on Fibonacci numbers, although in fact this tool can be used in much more cases. You can learn more about this tool and learn how to work with it in our full-time Forex training courses.