Market trends. Performing transactions with non-deliverable financial instruments according to the trend
All technical analysis is generally divided into two major sections:
1. Graphical analysis (analysis of trends, figures, candlestick patterns).
2. Computer analysis .
In this lesson, we will explore some of the basic concepts of the first section that relate to identifying, studying, and predicting trends (tendencies).
If we make a chart of any instrument and track its movement over a relatively long period (day, week, month), we can notice that the asset price moves in a zigzag pattern, being in continuous movement. This is due to a large number of market participants, each of whom seeks to make a deal with the maximum benefit for themselves (buy as cheap as possible, sell as expensive as possible).
However, in general, the price always has a specific direction, which is called a trend. Trend — the directional movement of prices down or up over a long or relatively long period. The main goal of a technical analyst is to recognize the current direction of price movement and make transactions either under it or on corrections. Figuratively, the trend is sometimes compared to a wave running to the shore. The best thing a surfer can do is ride on top of that wave, and the most dangerous thing is to try to swim against it. t is clear that the trend may change at any time, but you can roughly determine this with the help of computer indicators, which will be considered later.
Depending on the direction of the price movement, we distinguish three types of trends:
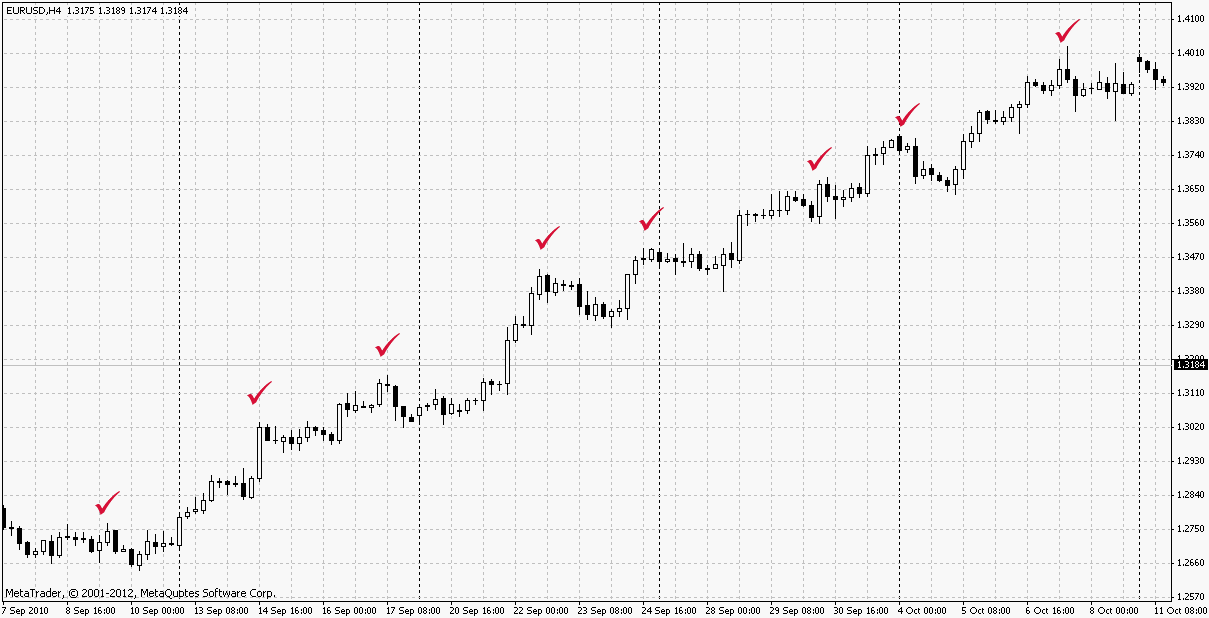
- Ascending (bullish trend) . The main sign of such a trend is each subsequent high and low above the previous one. If such a trend occurs in the market, all the client needs to do is buy near the lows and close deals when the price passes a sufficient distance. At the same time, depending on the size of the investor’s capital, as well as his patience and experience, he can use different tactics. The first is to take short- term movements, opening and closing a lot of transactions, and the second is to try to take the whole movement, buying at the beginning of the trend and patiently waiting for the signal to end it.
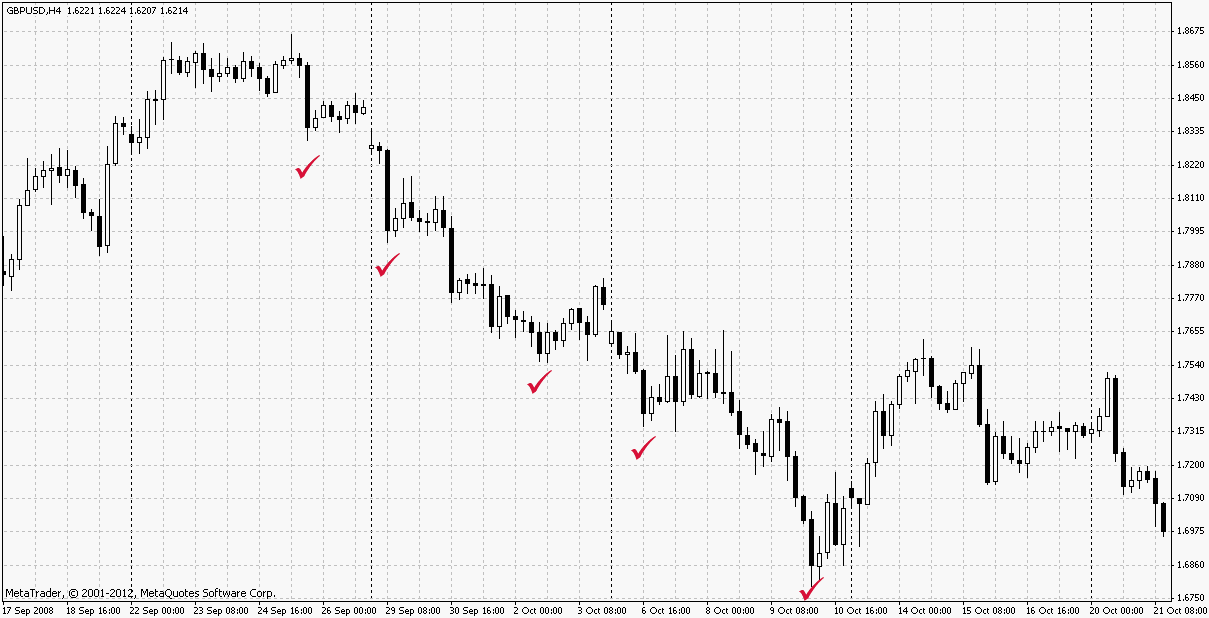
- Downtrend (bearish trend). The main sign of this trend is each subsequent high and low below the previous one. If this trend occurs, in contrast to the previous case, the client should sell near the highs and close transactions at the lows. At the same time, the downward trend is well suited to impatient clients, since the price drop often occurs in sharp spurts, in contrast to the growth, which is usually smooth and slow.
- Sideways (trendless market, «flat»). The main feature of this trend is that each subsequent high and low is approximately equal to the previous one. The sideways trend indicates indecision of both buyers and sellers. Both bulls and bears test each other, testing support and resistance, but there is no decisive action. Two strategies work on a sideways trend: making deals in the range (on the rebound) and waiting for a channel breakout.
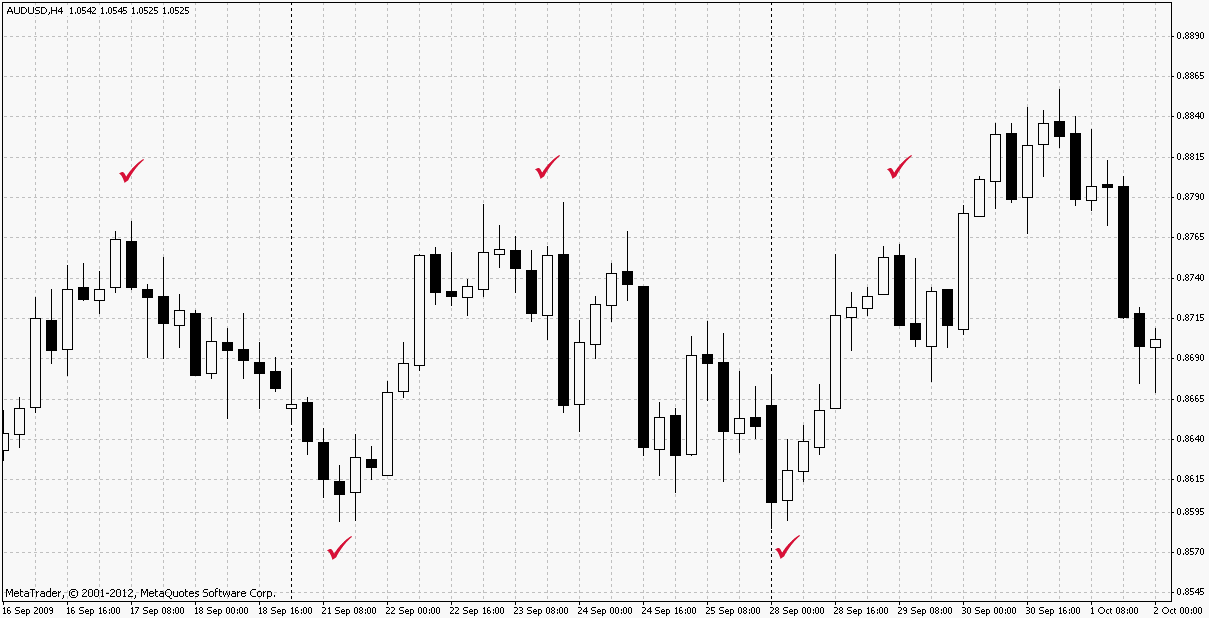
As a rule, the lateral movement always occurs within a certain range. The upper part of this range is the resistance, level, which players are trying to hold on the fall (bears), and the lower part is the support level, which is controlled by the bulls. Buying in the support area and selling on the resistance, you get an excellent opportunity to earn money at low risks since Stop Loss should be placed on the opposite side of the level, at a small distance. And the closer to the level you open a trade, the smaller the size of the stop order will be.
In addition to making deals to rebound from levels, many clients expect a breakout movement It is believed that when the price breaks through the resistance, the bears lose their positions and the market will grow, and after the breakdown of support, the opposite is true: the bulls close deals, allowing the market to fall further. The only problem, in this case, is the possibility of a false breakout, when the price goes out of the range, and then returns to it, sweeping away the stop losses of small market participants.
Trend duration
By duration, a trend can be:
- Long-term— from several months to a year or more.
- Medium-term— from a few weeks to two to three months.
- Short-term— from a few days to several weeks.
For most novice clients Forex in Belarus, it makes sense to track short-term and medium-term trends, leaving long-term trends for large players. When identifying trends, the most useful timeframes are daily (D1) and four-hour (H4). It is on these timeframes that we identify key levels and trend lines, and on smaller intervals ( for example, H1) we look for entry points to the market.