Types of stock charts
Before you start analyzing charts, you need to understand what type of market representation can be used to predict prices and how different charts are built. Today clients use one of three types of charts:
- Line chart
- Bar chart
- Japanese candlesticks
Line chart
It is a horizontal and vertical axis, the first is the time, the second is the price. The time on the chart is taken in equal intervals (for convenience), for example, the interval can be one hour. In a certain period (for example, 15 hours, 00 minutes, 00 seconds), the underlying asset (a pair of foreign currencies) has its price, which is indicated on the chart. Exactly one hour later (04:00:00 p.m.), the price will be at a different level, and so on. The resulting points are connected by lines, so we can track the price movement for a certain period. The drawback of the line chart is that it does not provide us with information about prices within a given period. That is, for example, we know what happened at 16: 00 and 17: 00, but we can only guess about price movements within this range.
Bar chart
A more complex and specific chart, but much more informative than a linear one. The main drawback of the line chart is that it tells us only about one price for a specific period ( in the above illustration – per hour). The price can change several thousand times in an hour, and we need to know if not all the changes, then at least the range of fluctuations. A bar chart consists of a large number of bars, each of which is the same period ( for example, an hour, as in the previous example). However, this time we will see not one price, but four, which will give us a complete picture of the fluctuations in the value of the underlying asset.
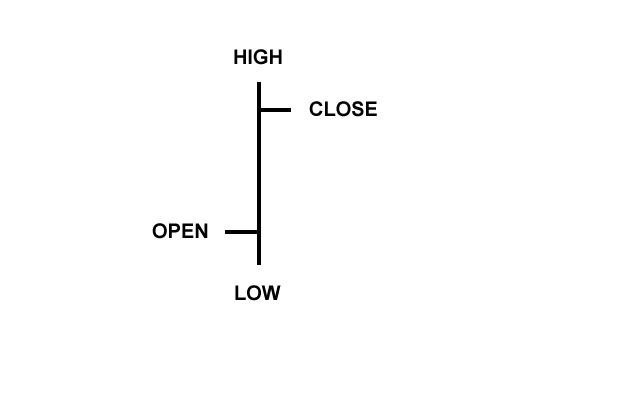
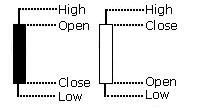
High Price — the highest price for some time.
Low price — the lowest price in a period.
Open price — the opening price (beginning of the period).
Close price — closing price (end of period).
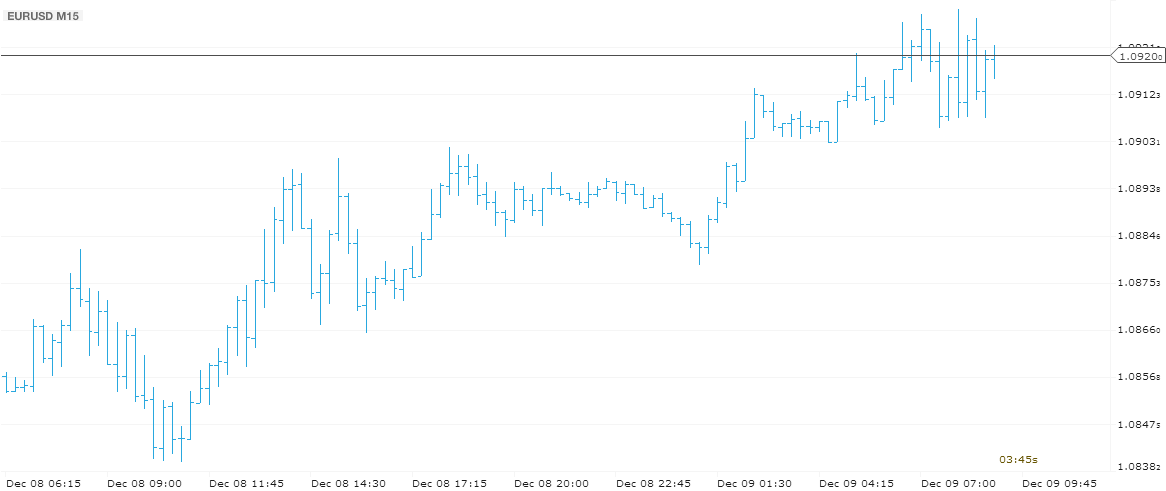
Thus, the line chart only allows us to compare intervals (03:00:00 p.m. compared to 04:00:00 p.m., etc.), and the bar chart allows us to analyze the movement within the interval. For example, if we analyze the column in the image above, we can not only say that the price has increased over some time, but also see the range of movements within this period (and it is much wider than the boundaries between opening and closing). In the image below, you can see the bar chart of the EUR/USD pair with the M15 period.
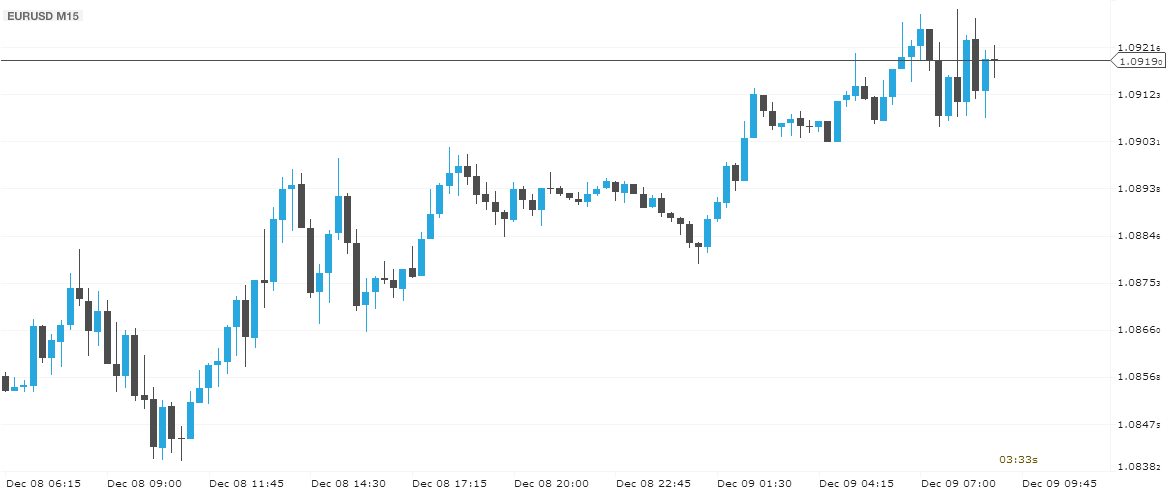
The chart «Japanese candlesticks»
Candlestick charts begin their history in the 18th century in Japan, where rice merchants marked the days of rising and falling prices with black and white stones. Based on this information, they tried to predict upcoming price movements. Today, «Japanese candlesticks» are one of the most popular types of charts, because they are very informative and at the same time allow you to quickly determine the periods of growth and fall of the price, in contrast to the bar chart. In general, we can say that candlesticks are the same columns where the opening and closing prices are connected in rectangles.
The rectangle is called the «body of the candle», and the maximum and minimum price indicators are called «shadows». The most important feature of the graph is the colour of the rectangles. If the price for some time ( for example, for an hour) fell, the body is painted in one colour (in our case, black), if it grew — in another colour (in our case, white). Thus, we can look at the chart and immediately determine the main direction, already based on which candles are more. Also, there is a whole line of analysis called «candlestick patterns», which can only be used to determine possible price trend reversals based on the sequence of candles. Below you can see the same EUR/USD M15 chart but in the form of Japanese candlesticks.