Japanese candlestick patterns
The main difference between candlestick patterns and price patterns is that if the pattern analysis is based on the search for highs and lows and their subsequent interpretation, then here we will be interested in specific candles, their appearance and sequence of appearance. In this lesson, we will analyze only a few candlestick patterns to show you the essence of this analysis. The fact is that the number of models known today is measured in dozens, and their study is the subject of a separate face-to-face course at FTM Brokers.
As in the case with graphic figures, candlestick patterns are divided into two groups: reversal and continuation of the trend. Moreover, the first group is much more reliable and more numerous.
One of the most famous candle patterns is – a shooting star, which indicates the completion of the upward movement.
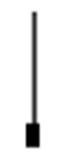
A shooting star is a candle with a small body and a very long upper shadow, and this candle appears at the peak of the market. Both black and white body colours are allowed, but a stronger signal arises precisely if the candle closes with a fall.
In order to consider a candle as a «shooting star», it is necessary, firstly, that it crowns itself with an upward movement, and secondly, the length of the upper shadow should be at least twice as long as the body of the candle. This long shadow indicates that the market tested the resistance level, and sellers prepared to open short positions. The shooting star at the top of the uptrend indicates that the upward trend, at least for a while, is coming to an end. Nevertheless, we recommend using other technical analysis tools along with the candlestick model to increase the effectiveness of the Forex forecast. You should also keep in mind that you need to wait for the candle to close before opening a new deal, as the shape of the shooting star may change right before the end of the time frame.

Like price models, candlestick patterns also have mirror «doubles» that occur at the bottom of the market. In our case, the opposite of a shooting star is a hammer.
Now let’s analyze the trend continuation models. They are used by customers in order to confirm the further movement of the market in one direction or another. Often, continuation patterns appear after a long period of stabilization or correction in the market.
Here’s what continuation patterns look like when prices are in an uptrend:
Three white soldiers
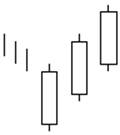
Three white soldiers is a model that consists of three bullish candles of the same shape. Each of the candles opens a little lower and closes above the previous one. Moreover, if the candles have no shadows or they are almost invisible, the strength of the figure increases. When the «three white soldiers» pattern appears, you can open a long position to continue the trend.
The opposite situation is the figure of «three black crows».
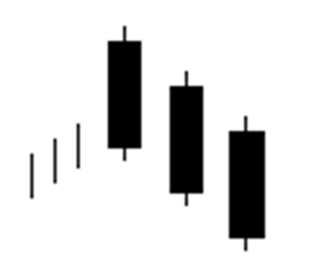
This model consists of three bear candles, which have a similar design. Each candle closes lower than the previous. Candles without shadows increase the strength of this pattern.
Candlestick patterns are important tools that help in technical analysis and understanding of market psychology. Thanks to them, you can determine potential turning points in the market, so they are often one of the most important elements of a strategy for technical clients.